

GETTING THINGS ROLLING, COMBINING DATA IN SAP ANALYTICS CLOUD VERSUS SAP DATAWAREHOUSE CLOUD (1/2)!
Since our latest blogs about SAP Datawarehouse Cloud, we have received many questions from customers that want to learn more. One of the questions which keeps popping-up is how to position and compare the Data Builder capabilities in SAP Datawarehouse Cloud with the modelling capabilities in SAP Analytics Cloud. In this blog we will use one of our previous use cases and will try to rebuild the fact view created in SAP Datawarehouse Cloud using whatever SAP Analytics Cloud has to offer today.
Our demo
Just for the record, this is our demo scenario:
At Interdobs we have a standard demo-set that we use for our own demo scenarios based on data coming from RDW. The RDW is the Dutch Vehicle Authority in the mobility chain. RDW is the authority that gives out license plates but is also responsible for the yearly MOT inspection and keeps track of all data of the cars driving around in Holland. The nice thing is that RDW stores data about all their processes and makes this available via the Open Data protocol.
Basically, we have two datasets in this scenario: the issues that have been recorded by the garage and were sent towards RDW and the recalls coming from the producers. In our demo, we want to combine the two datasets to get information about our favorite car: Peugeot 308.
GETTING DATA IN
We use three main data sources to create our output: two local files and data from our HANA database. Let’s start with the largest file, approx. 160mb. In the new trial of Datawarehouse Cloud, the size of the file can be 2gb where it was 20mb.
Creating a model in SAP Analytics Cloud based on a file is also a piece of cake. No limits here, the full 3.4 million rows are loaded into the model without any issues. There is an interesting notification displayed for our demo scenario when creating the model. The dimension ‘Kenteken’ or license plate has too many unique values and will be read-only in the model. Let’s see what the effect is later when creating a story.
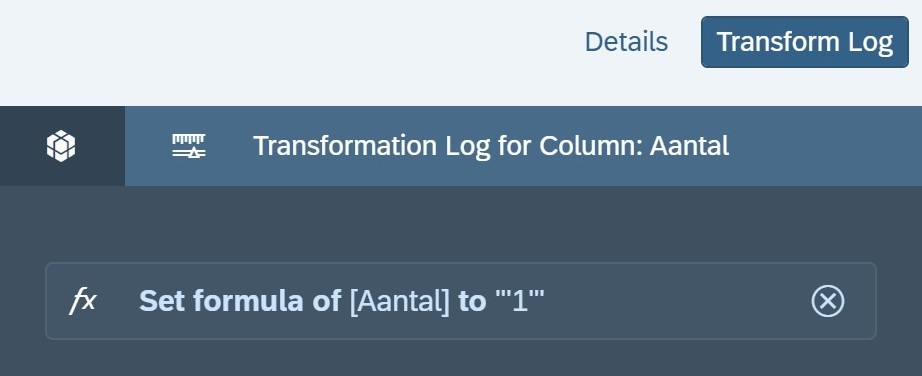
Since there is no measure detected in our local file, we create a calculated column ‘Aantal’ with a constant value of ‘1’ similar to the ‘fx’ function to build calculated columns in SAP Datawarehouse Cloud. A cool feature in SAP Analytics Cloud, by the way, is the ‘Transformation Log’. Each activity you perform before creating the model is captured in this log and can be rolled back.
Like SAP Datawarehouse Cloud, SAP Analytics Cloud offers capabilities to combine data sources into a single output or model.
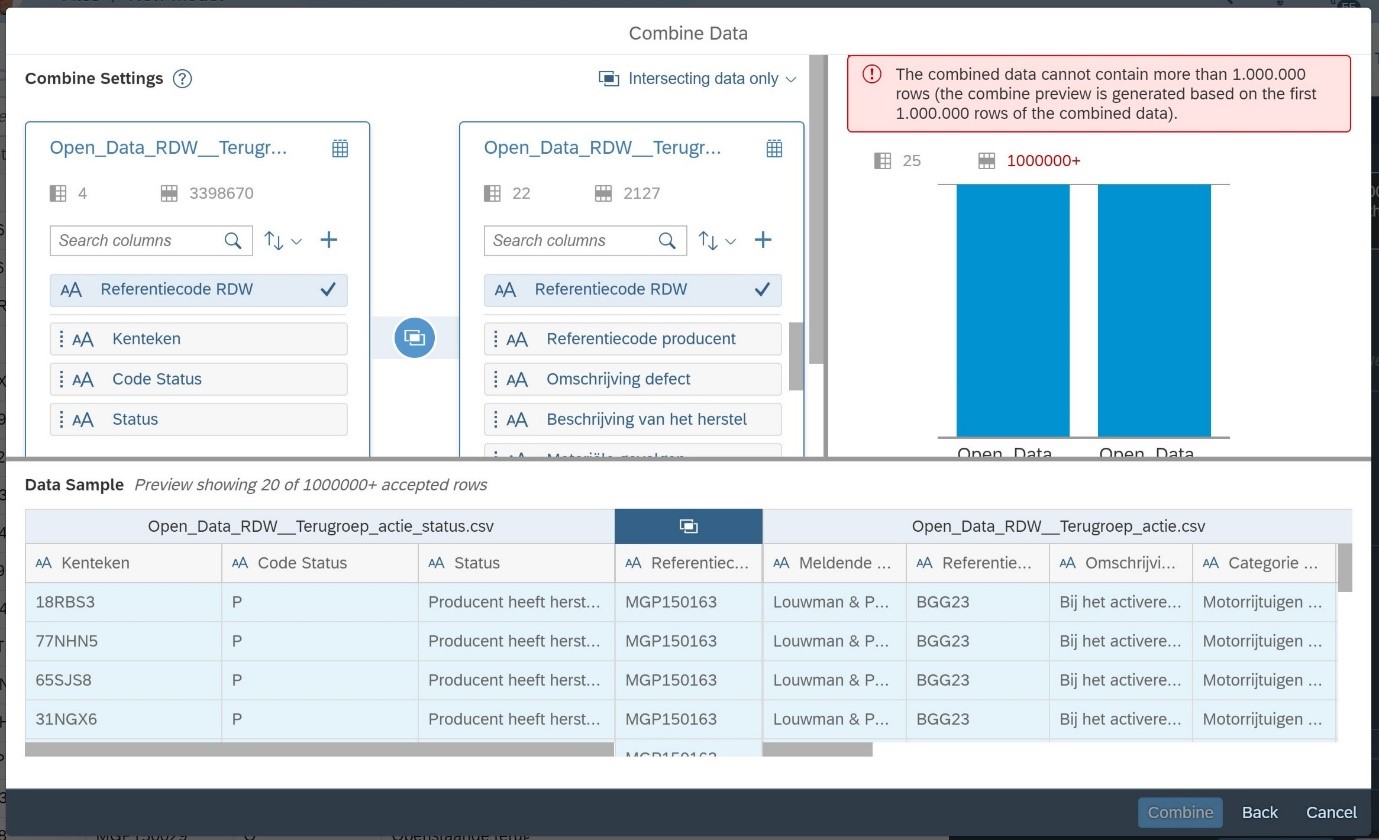
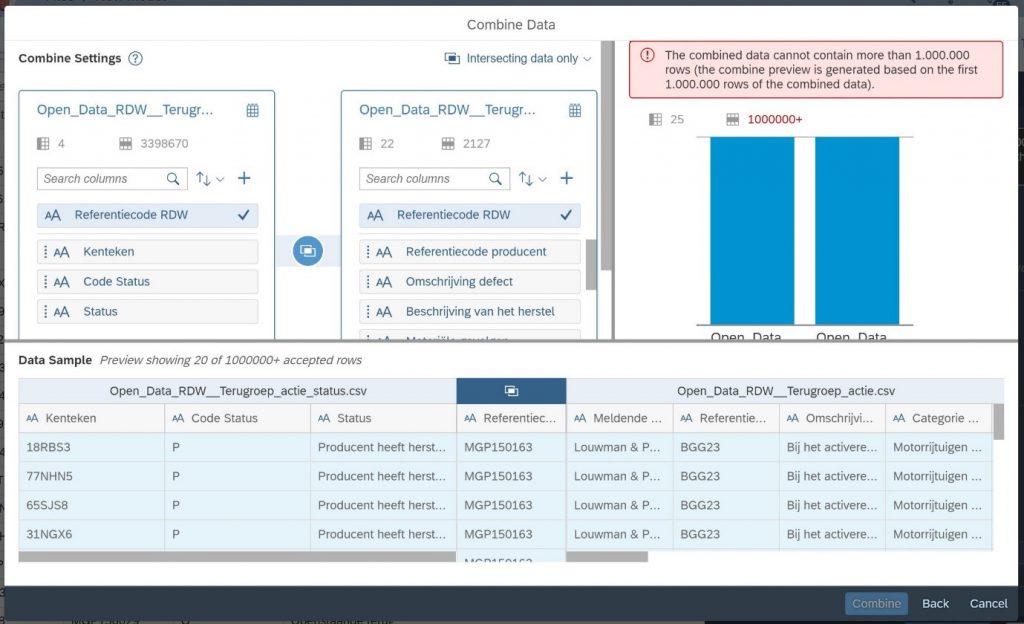
Via the ‘Combine Data’ feature, you can select a second data source by uploading a file or selecting data via an import connection. The option to combine data is limited to import data sources and doesn’t offers capabilities to use a live connection or a remote source like in SAP Datawarehouse Cloud.
When defining the ‘Combine Settings’, we bump into a limitation of SAP Analytics Cloud: our combined data cannot contain more than 1 million rows.
Because we want to use these data sources, we must look at other options in SAP Analytics Cloud offers: linking models. This means that we will create three separate models and will link them in the story.
When creating the second model we stumble upon another difference: there is a limit on the number of characters for a dimension in SAP Analytics Cloud. While SAP Datawarehouse Cloud lets you define the length of a string, it’s limited to 256 characters and data wrangling activities need to be performed to reduce the number of characters. Furthermore, we can’t use a similar feature like a projection to limit the number of dimensions that are available when creating a story. SAP Analytics Cloud is limited to hiding the columns while creating the model.
The final model is based on data in a HANA table. Before SAP Analytics Cloud can consume the data, a calculation view needs to be created and deployed in HANA while SAP Datawarehouse Cloud offers more flexibility to use a table in a schema as a remote table.
SUMMARY
Now that we created 3 models, we can try the concept of linking models in an SAP Analytics Cloud story to combine the data. But before we will explain how in part 2 of this blog, let summarize some of the difference we came across when trying to combine data for this demo in SAP Analytics Cloud using models:
- Creating models in SAP Analytics Cloud is easy.
- SAP Analytics Cloud offers capabilities to combine two data sources but has some limitations in terms of the number of rows, columns, etc.
- Adding calculated columns is similar but SAP Analytics Cloud offers more capabilities to perform all kinds of transformations on your data source, if necessary.
- SAP Analytics Cloud can’t connect to remote tables, you need to create a HANA calculation view first.
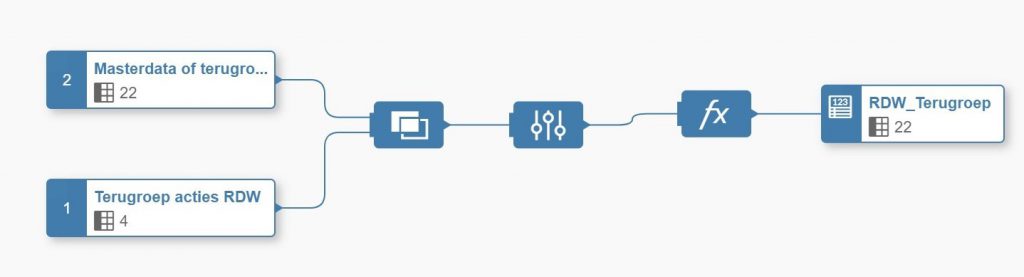
Based on this use case we can conclude that SAP Datawarehouse Cloud offers more capabilities to create a single data model based on multiple different sources compared to SAP Analytics Cloud. Instead of creating three separate models we can create reusable building blocks from the repository and combine that in a single fact view which is ready to be used in the story builder.