


GETTING THINGS ROLLING, COMBINING DATA IN SAP ANALYTICS CLOUD VERSUS SAP DATAWAREHOUSE CLOUD (2/2)!
In part 1 of this blog, we concluded that SAP Datawarehouse Cloud offers more capabilities to create a single data model compared to SAP Analytics Cloud. Now let’s see whether we can combine the three separate models in the story and visualize the data. But first we take look at how we can visualize data using the ‘Story Builder’ in SAP Datawarehouse Cloud.
Create story
After creating a single ‘fact’ view of our 3 data sources in SAP Datawarehouse Cloud, we switch to the ‘Story Builder’ which is an embedded version of SAP Analytics Cloud. It doesn’t contain the full scope of an enterprise version of SAP Analytics Cloud but almost everything from the ‘BI’ part is there.
When browsing to the ‘Story Builder’ we have an option to open either an existing story or to create a new one. After selecting to create a new story we must select which fact view we want to use. This workflow differs from SAP Analytics Cloud which offers capabilities to selects models or add data uploaded from a file or another data source.
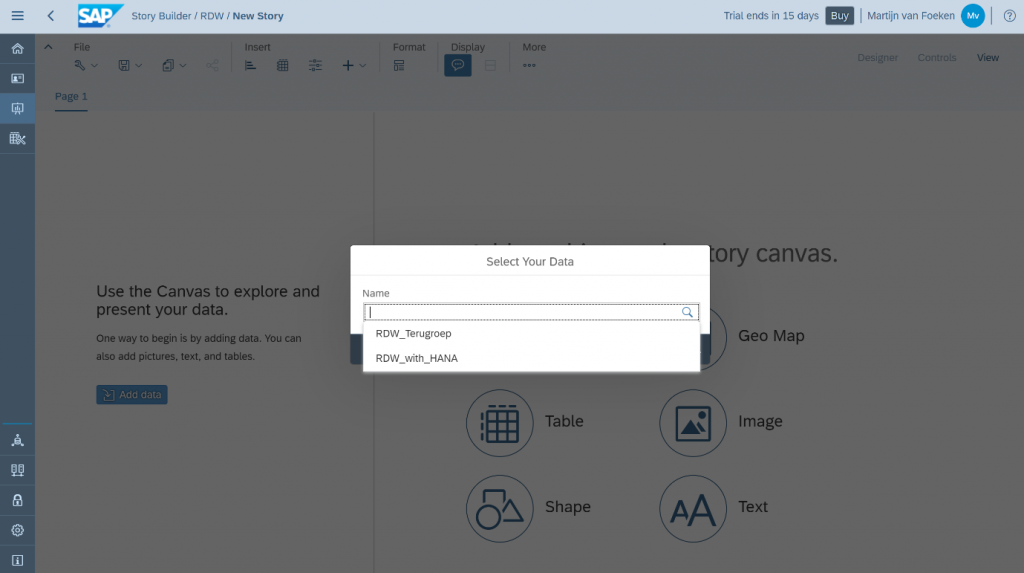
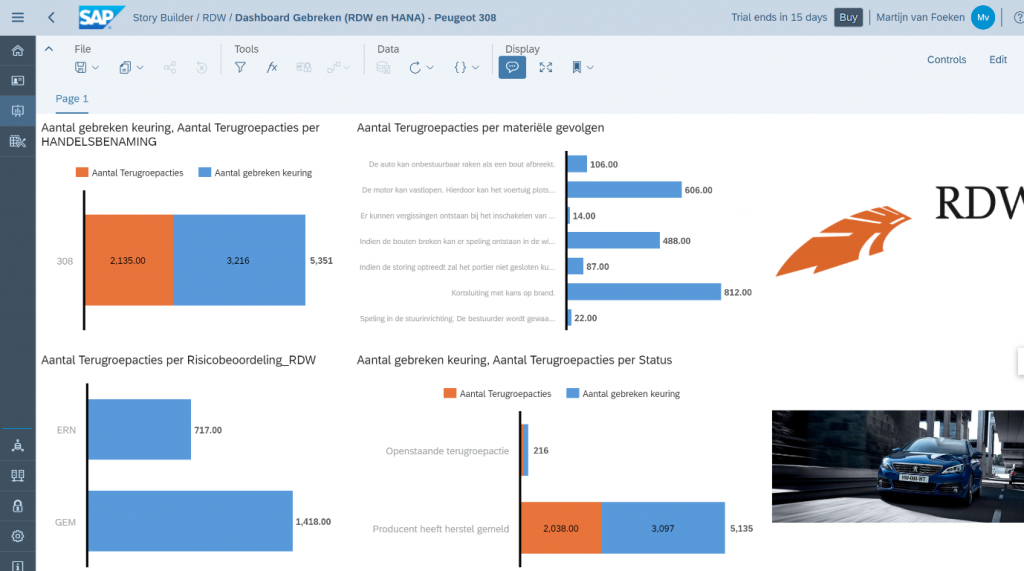
After selecting our ‘RDW_with_HANA’ fact view we can start adding widgets and to the canvas to explore and present the data, just like in the enterprise edition of SAP Analytics Cloud. Main difference is that all the measures and dimensions from our 3 data sources are accessible from a single model. Now let’s see if we can achieve the same result in SAP Analytics Cloud.
LINKED models
Linking models is also referred to as ‘Blending’ in SAP Analytics Cloud and is supported via three different technologies. While blending of two live SAP HANA models and all import models is supported natively (within SAP Analytics Cloud), other scenario’s (view this page for more details), require technologies like Smart Data Integration (SDI) or Browser based blending. With Browser based blending data is temporarily stored in either the Primary or Secondary data source where the blending itself occurs. In our demo we use Browser based blending and as we will see this has restrictions which you need to take into consideration.
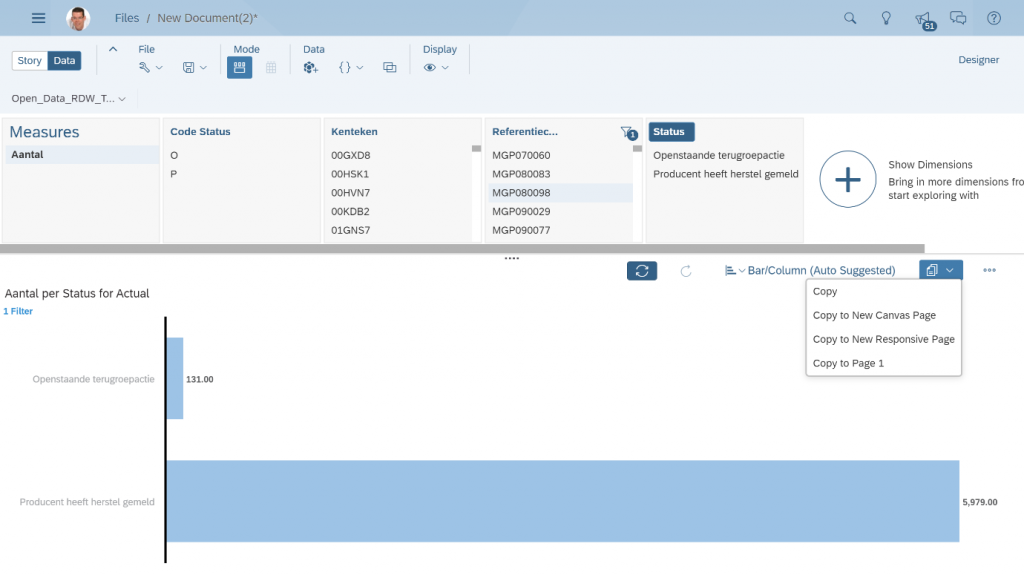
Let’s start with creating a storing and adding the first model. After browsing to the model, we are presented with the ‘Data’ tab as a starting point. This is very useful if you simply want to browse through your data set and it offers capabilities to start building visualizations and copy them to story pages right away.
Next step is to add the second and third model and to define how the models should be linked based on the common dimensions in our data model.
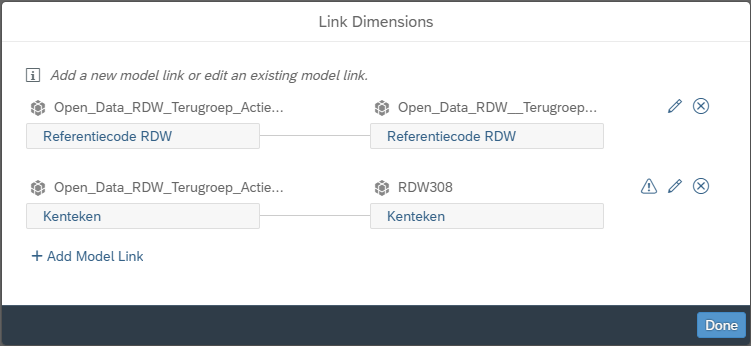
To link the models, select ‘Link Dimensions’ from the ribbon. First action is to link the 2 models of the imported data sets together. We select the shared dimension and create a link based on the ID.
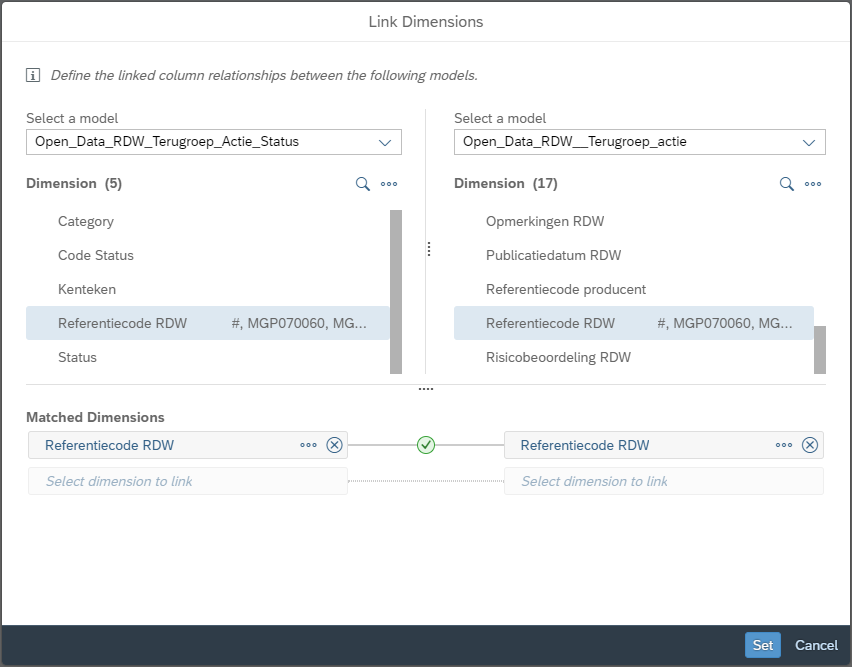
Now let’s link the first model with the model based on live SAP HANA data. When we select this model a warning notification is displayed which basically means that there are restrictions in terms of the blend that we want to perform. Currently Browser based blending is limited to a data set of 2 MB. Now that the dimensions are linked, let’s see what visualizations we can create.
Visualize data
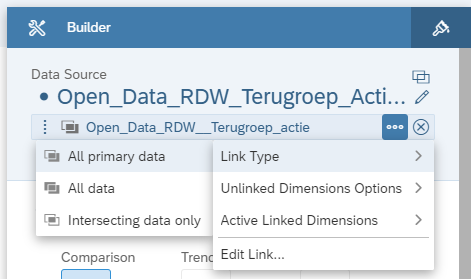
When we add a visualization to the canvas, we must select what the primary model is that we want to use. Next step is to add a ‘Linked Model’ so we can select measures and dimensions from both models (based on the linked dimension) into a single visualization. Besides the actual link, you can define the type which determines which data is displayed.
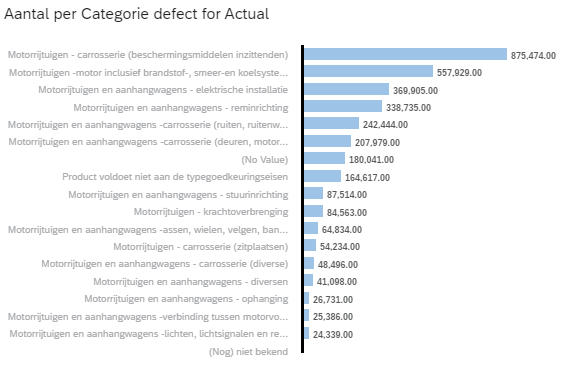
Our first visualization is a bar chart that combines data from models 1 and 2, both based on imported data, and therefore blended natively in SAP Analytics Cloud. As displayed below, we get information (sorted descending) about the number of occurrences of a certain category of defects.
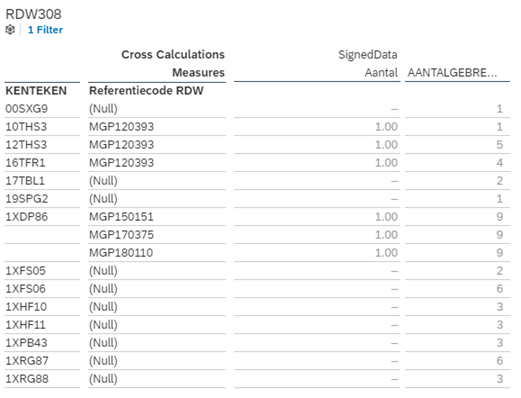
The second visualization blends an import model with a live HANA based model and contains the number of occurrences, defects and reference codes based on license plates. And this is where we bump into limitations. If I don’t filter on a couple of license plates, one of the blended queries will return an empty result (and displays (Null) values), most likely due to the blending limitations for browser blending given the dataset volume.
Other efforts to create meaningful visualizations in SAP Analytics Cloud like the ones in the story based on the fact view in SAP Datawarehouse Cloud all fail due to constraints of joining a large import data set with a live HANA model using Browser blending.
Conclusion
In context of our demo scenario, where we combine two flat files as an import model with a live HANA model, we have to conclude that although linking models is easy in SAP Analytics Cloud, the restrictions applicable when using Browser based blending limits the user in creating visualizations based on multiple linked models.
SAP Datawarehouse Cloud offers flexibility creating a single data model (fact view) that doesn’t enforce any constraints when building the visualizations in the story. If you modelled the data sources correctly, you don’t have to think about how models should be linked, what the primary and secondary data set is, and which limitations are applicable for the blending technology enforced by the types of data sources.
We see that SAP Datawarehouse Cloud offers capabilities that SAP Analytics Cloud doesn’t offer in terms of creating a single data model based on multiple data sources. Does that mean that SAP Datawarehouse Cloud is always a necessity to create models? Surely not, there are quite some scenario’s where linking models can be done successfully. What we do see is that SAP Datawarehouse Cloud in combination with SAP Analytics Cloud truly extends de modelling capabilities of SAP Analytics Cloud. A big plus for our end users!